The Equity Indicator Library serves as a reference tool to advance knowledge and understanding of inequity in communities.

The Equity Indicator Library increases understanding of equity in communities. Indicators are measures that identify something without directly observing it. The goal of the Indicator Library is to understand disparities in communities by assessing current and historical trends. Indicators can be used to motivate further research to define relationships between indicators and root causes. They can also be used to create measurable goals and make informed policy decisions to increase equitable outcomes.

1

Define objectives to clearly identify what problems or outcomes the indicators are going to inform

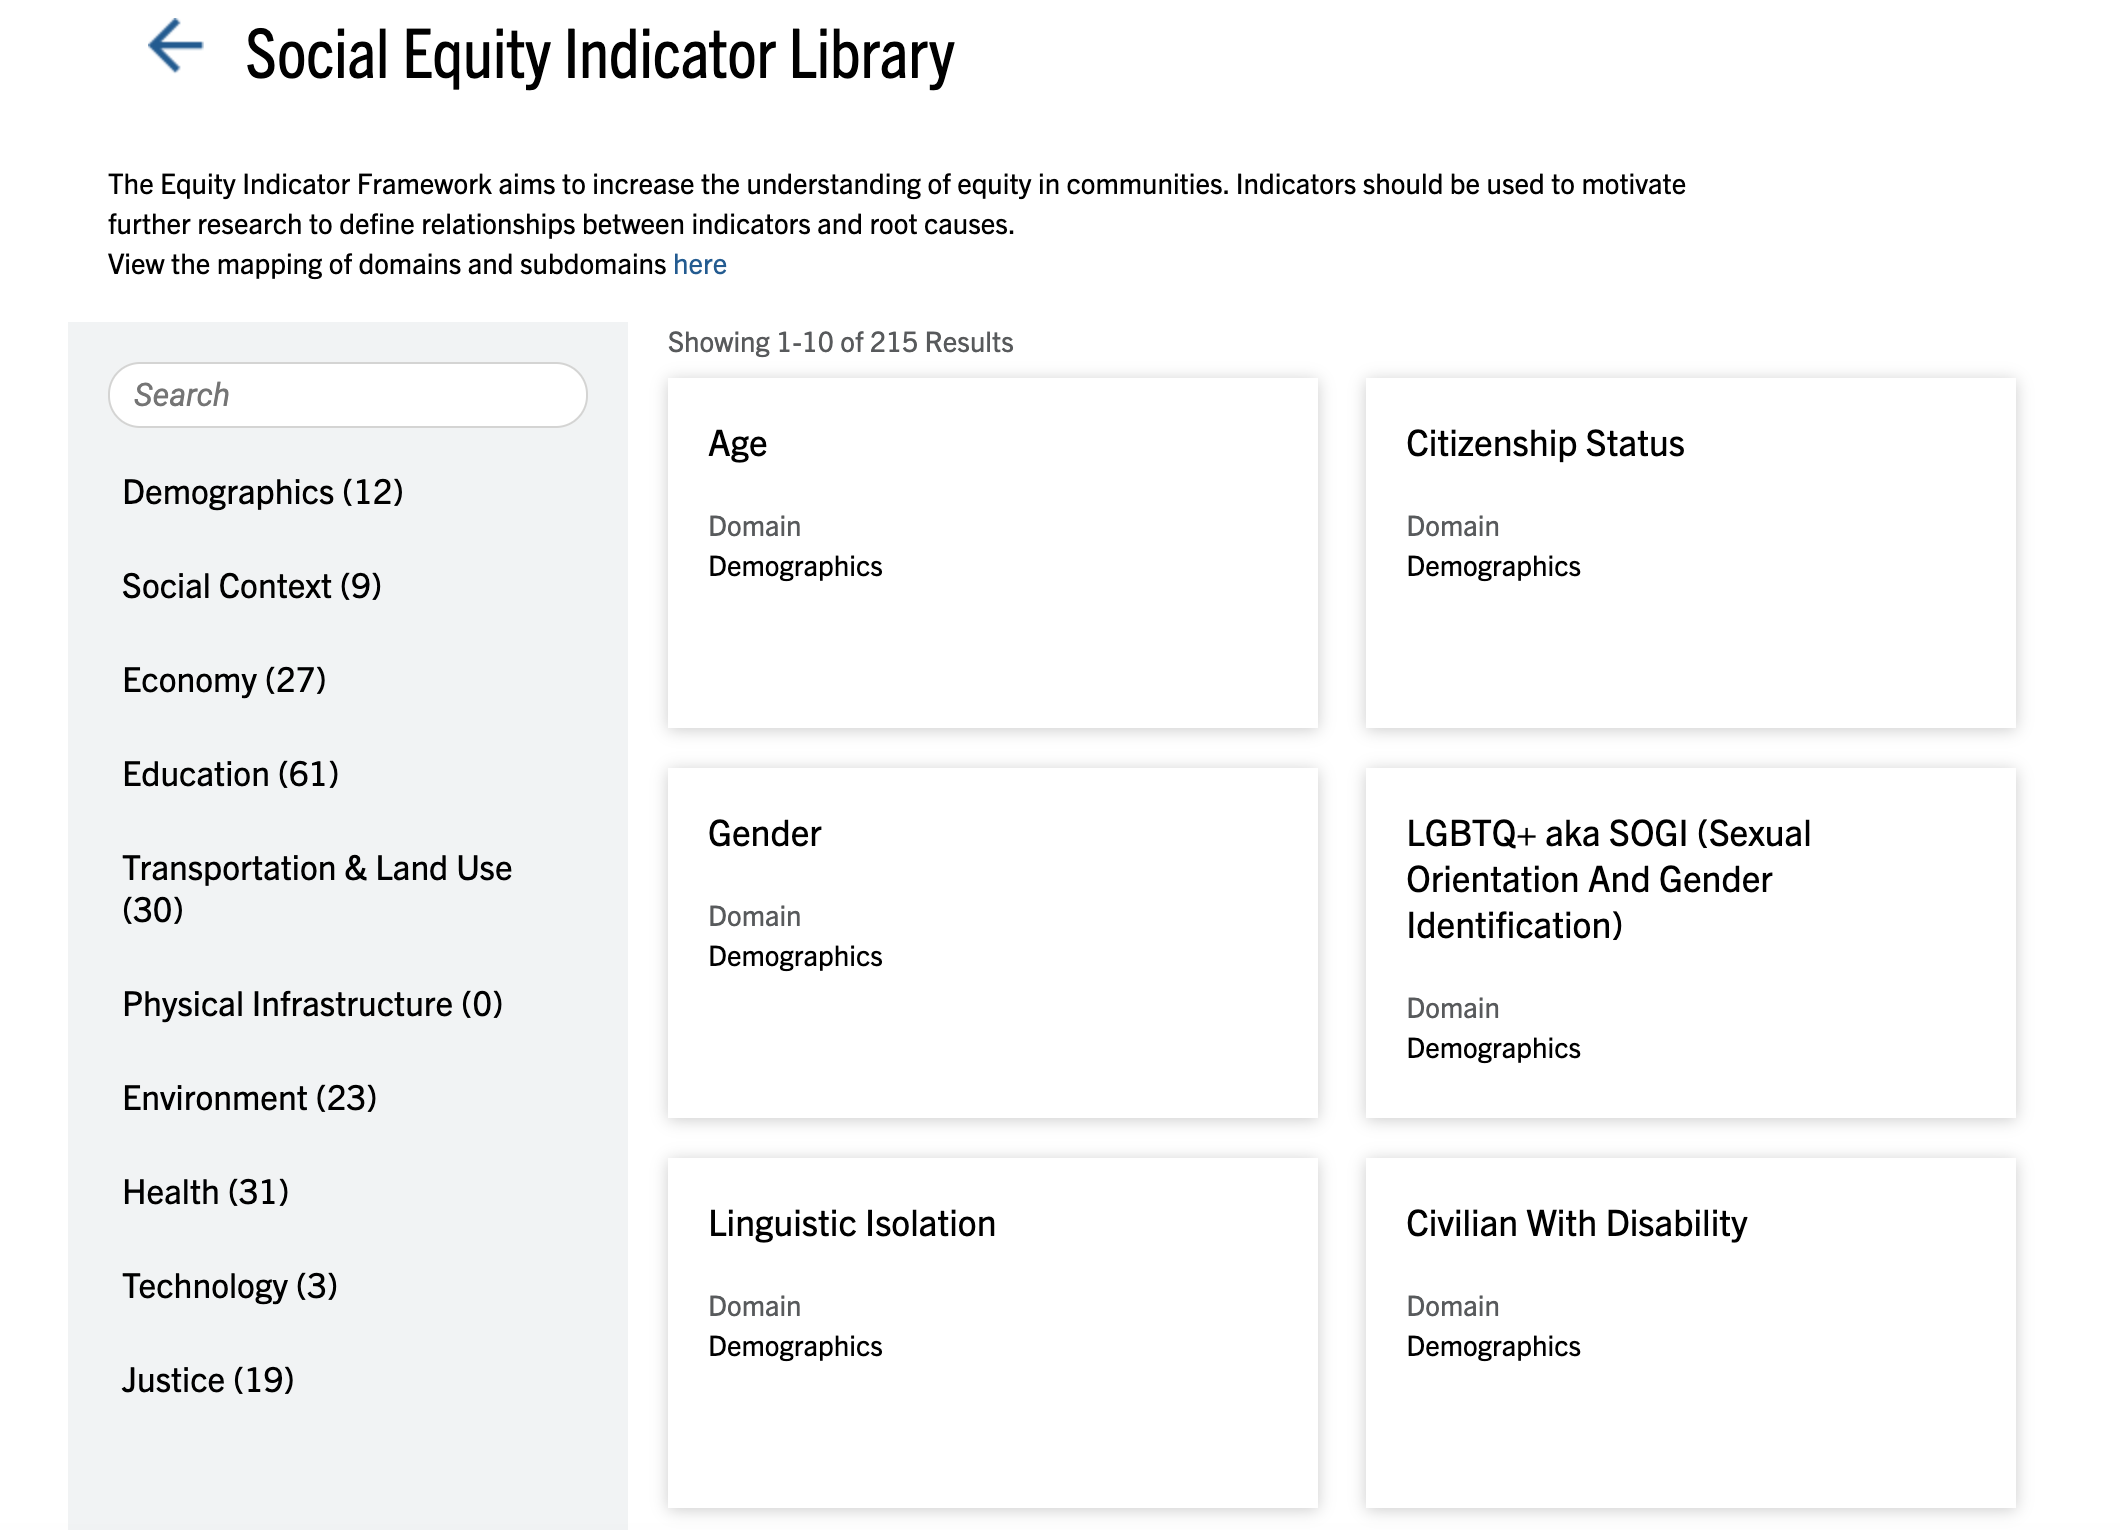
Define clear objectives to describe what the organization is seeking to learn about equity. Objectives should cover the project scope, such as areas, problems, communities, or policies that are being targeted for further research. Objectives should also identify the underserved or target populations the research seeks to learn more about. Multiple communities may be identified, and the term “underserved” may apply based on race, ethnicity, language, income, gender identity, religion, immigration status, or other factors.

A wall of assorted colorful post-it notes
2

Identify indicators by holding working sessions with a diverse set of subject-matter experts and stakeholders

Hold brainstorming sessions with experts to select an initial list of indicators based on objectives and then verify the list with stakeholders. The evaluation scale should be selected for each indicator before data analysis is performed.

A man presenting to coworkers in an office conference room
3

Collect Data

Identify and gather data on indicators. Review data sources and collect further data on indicators.

A teacher and group of young students at an estuary conducting science expirements
4

Analyze Indicators

Perform a statistical analysis on the data collected for the selected indicators to identify areas of further interest. Causal loop diagrams may also be used to model and understand interactions between indicators and objectives. Document insights, observations, and themes.

A young woman sitting in an office and writing in a notebook
5

Decide and Implement Changes

Make decisions and implement changes based on the statistical analysis and causal loop diagrams. Decisions could include collecting more data, implementing a new policy, or selecting indicators to monitor over time to reach a goal.

A young man standing and thoughtfully looking at a whiteboard
6

Monitor

Continue to collect data. Repeat the process starting at Step 3 to monitor the indicators over time and adjust as needed.

A young woman speaking on a cellphone with a city skyline in the background with abstract glowing dots and connecting dotted lines superimposed over the image