Exploring the Association Between Historic Redlining Policies and Poor Mental Health in Redlined Cities

As part of a research project funded by the MITRE Independent Research and Development Program, MITRE sought to better understand the impacts of place-based racial discrimination on mental health outcomes in U.S. cities by focusing on a specific federal housing policy implemented in the late 1930’s. The explainer below highlights key takeaways from an exploratory analysis of the association between historic redlining policies and poor mental health prevalence across cities that were part of the Home Owners’ Loan Corporation (HOLC) City Survey program, and identifies considerations for future research.

1

Historic Redlining Policies

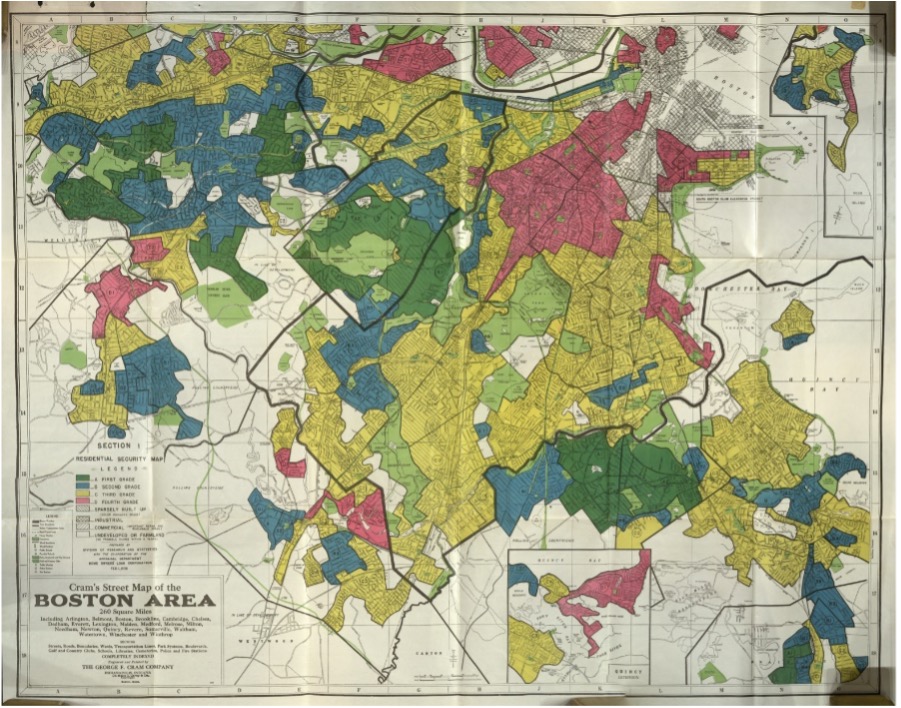
In the 1930s, the federal government created the Home Owners’ Loan Corporation (HOLC) as part of an effort to standardize lending and make homeownership more accessible for many Americans. HOLC created “Residential Security” maps of 202 cities across the United States as part of its City Survey program. Neighborhoods were assigned grades according to their perceived mortgage lending risk. HOLC grades ranged from “A” to “D,” where A-graded areas (shaded in green) were considered “best” or safest for investment and D-graded areas were considered “hazardous” due to “detrimental influences in a pronounced degree, undesirable population or an infiltration of it.” The presence of people identifying as racial and ethnic minorities was very likely to result in being marked as a D-graded investment. Lenders were discouraged from making loans in D-graded areas, thereby promoting segregation and disinvestment in areas where people pertaining to racial and ethnic minorities groups lived.

HOLC Map of Boston Area
2

Connection to Present Day Mental Health Outcomes

MITRE used statistical modeling to examine the association between historically redlined (i.e., HOLC graded) census tracts and present-day prevalence of poor mental health. In these models, MITRE observed that HOLC grades and poor mental health prevalence had different relationships across different cities. First, narrowing the analysis to large cities with more than 50 census tracts in a simple linear model, MITRE found a significant association between HOLC grade and prevalence of self-reported poor mental health in 63 of 66 (95%) cities. Next, applying a multivariate model to account for other factors related to income, unemployment, education levels, race/ethnicity, residential segregation, and housing, C- and D-graded tracts showed a significant association with poor mental health 24 (38%) of 63 larger cities examined, even when controlling for the factors noted above.

HOLC Grade Model
3

Chacteristics of HOLC-Graded Areas

Looking across all large cities, the MITRE team grouped together all tracts by assigned grade. In general, a greater overall proportion of individuals identifying as racial or ethnic minority groups and with lower household incomes tended to live in C- and D-graded tracts, and on average, people living in these areas also experienced greater housing stress, higher unemployment rates, lower high school completion rates, and more residential segregation compared to A- and B- graded tracts. However, when looking at the relationships of these characteristics within individual cities, the MITRE team found varying levels of significance, in both strength and direction. These different results at the city level and the aggregate level suggest that the relationship between HOLC grades and poor mental health prevalence is city-dependent and not generalizable across all cities when accounting for related covariates.

HOLC Grade Model 2
4

Case Example: Applying the Model to Baltimore, Maryland

To further explore potential applications and considerations for the model, MITRE looked at the example of Baltimore, Maryland, a city with a positive, statistically significant association between HOLC grade and prevalence of poor mental health. Out of 272 HOLC-graded tracts in Baltimore, 66 are formerly redlined (i.e., D-graded).D-graded tracts in Baltimore exhibited large distribution ranges (i.e., a broad variation in values) for covariates related to housing stress, household income, and high school completion. These large distributions for D-graded tracts may be indicative of patterns of neighborhood change, such as gentrification and blockbusting, in some D-graded tracts, where some populations in historically redlined areas have been displaced by wealthier, Whiter populations, while others continue to experience conditions of disinvestment.

Baltimore, MD
5

Case Example: Stratifying the Model for Baltimore by Percent Non-White

To better understand the findings from the initial modelling for Baltimore, the MITRE team stratified the multivariate model by the percent of the population that is non-White, to compare tracts below the median (i.e., with a higher proportion of people who are White) to tracts above the median (i.e., with a higher proportion of people pertaining to racial and ethnic minority groups). Overall, the findings suggest that patterns of neighborhood change, such as gentrification and blockbusting, warrant future investigation to better understand their relationship with these variables.

Baltimore, MD HOLC Grade Model
6

Considerations for Future Research

Overall, while historic redlining is associated with poor mental health in modern cities, national-level analyses related to historic redlining are limited due to the localized context (i.e., lack of standardization) of Home Owners’ Loan Corporation (HOLC) grades, as well as numerous other factors. Therefore, the precise relationship between HOLC grades, current poor mental health prevalence, and other socioeconomic indicators such as ICE, Non-White by Income is highly complex and city-dependent, especially given that the policies and populations of historically redlined areas have not remained static over the past 90 years. Future research and analysis would benefit from applying metrics for other patterns of neighborhood change, such as gentrification and blockbusting, and neighborhood investment levels. A more complete understanding of the ways in which historic discriminatory policies continue to shape current health inequities may help guide more evidence-based investments and decisions related to health and social policies and programs.

Overhead view of city, high contrast