The Racial Wealth Gap and Your Household Finances

Building on previous work with The Council of the District of Columbia's Office of Racial Equity (CORE) to examine the racial wealth gap in Washington, D.C., MITRE has developed a household finance model to learn more about how racial inequity impacts wealth and to help users answer questions about the wealth gap. In a previously published report (The Racial Wealth Gap in Washington, D.C.), we mapped a wide range of factors that influence wealth building, and provided context from research on the historical oppression, ongoing policies, and inherited inequity that contribute to the racial wealth gap. The report resulted in several follow-on questions, including:

  • How do factors that influence wealth building impact residents and households?
  • What proposed interventions may influence the bottom line for residents?

This model can help us understand the dynamics of the racial wealth gap, and in conjunction with community design can support evaluating the financial impact of proposed policies and interventions.

The median net worth of a white household is 81 times that of a Black household in D.C. 1 While community and cultural assets play a critical role in supporting Black households in D.C., this wealth disparity leads to an uneven financial foundation with wide-ranging and long-lasting impacts. Some questions this model seeks to help answer include:

  • What financial, social, and historical factors led to this racial gap in net worth?
  • Is the gap widening or shrinking?
  • How would different financial policies affect the gap?

On this page, we walk through a simplified household finances dynamic model with a focus on how racial inequity translates into the wealth trajectories of two residents, represented as the median conditions of a Black D.C. resident and a White D.C. resident.

The term “dynamics” refers to the study of things in motion—in other words, how they change over time. Bringing a dynamic perspective to studying the racial wealth gap means trying to understand its history and future, in addition to its current state. Using a dynamic perspective rather than a static perspective also helps us look at its structures and causes, examining what influences the wealth gap and how. This model provides a way to understand the dynamics of the racial wealth gap by projecting household finances forward in time, assessing whether the gap grows or shrinks when various contributors to the wealth gap are adjusted. Though factors such as income, expenses, and interest rates change over time in the real world, for the purposes of this model these factors are held constant to simplify the model and understand general trends. i

This page focuses on factors that impact household finances and the racial wealth gap and uses two fictional personas: Nicole (a Black D.C. resident) and Lauren (a White D.C. resident), who both grew up in and live in D.C. Other demographic and social factors also impact household wealth. Wealth gaps widen even further, for example, when examining gender and race together. Once again, to simplify the model and understand general trends, the example described here focuses specifically on race.

The page is broken up into sections, each of which discusses and models one of these factors. Nicole and Lauren have been assigned the median values of several conditions impacting household wealth for DC residents of their respective races and are used as demonstrative examples throughout.

Follow along below to learn more about the factors that influence the wealth trajectories of these two women using the interactive charts, which project changes in wealth over a 20-year period. The accumulation of wealth is measured by net worth which is the sum of all the assets someone owns minus their debts. 2 The cumulative effects of income (in the “Work Compensation” section) and expenses (in the “Cost of Living” section) carry forward throughout the graphs and into the other sections. To see the 
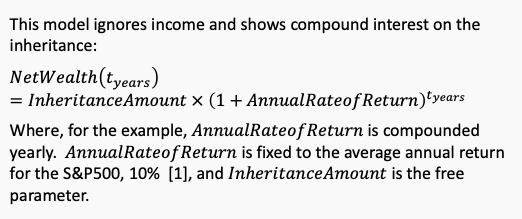
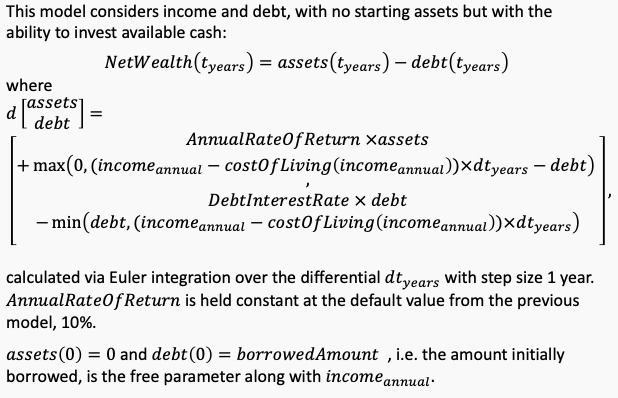
individual effects of employment security, inherited wealth, return from investments, and interest from debt, click the box next to “equalize Lauren and Nicole's...” within each section. The final graph displays the cumulative effects from the values inputted in all sections.

1

Work Compensation ii

Differences in work compensation for wage and salary workers throughout their career contribute to differences in wealth over the course of workers' lifetimes. Various factors, including barriers to education access, differences in social capital, and hiring discrimination led to diverging occupations among racial groups. A higher salary occupation increases income, which in turn increases an individual's access to other resources, such as education, healthcare, and training. A higher salary also increases an individual's ability to invest in other wealth building feedback loops. Positive feedback loops are continuing patterns of investment where the result of the investment, such as receiving a return on investment, reinforces the action. 3 Even in the same occupational categories, there are disparities in the average salary for Black employees compared to White employees. 4 In addition to differences in salary, many lower-wage occupations have limited employer-provided benefits, which offer financial resilience, support workforce readiness, and help build personal assets and wealth, such as retirement matching programs, company stock options, tuition assistance, and health insurance.

Nicole works as a cashier (the most common occupation for Black residents in D.C) 5 while Lauren works as a lawyer (the most common occupation for White residents in D.C). 6 If Nicole's annual salary as a cashier is $48,500 (the approximate median income for Black D.C. households in 2019), and Lauren's annual salary working as a lawyer is $155,600 (the approximate median income for White D.C. households in 2019), iii 7 and they start out with equal wealth at age 20, the interactive graph below shows how their wealth will grow over time. Use the sliders to see the impact of changing Nicole and Lauren's salaries. The graph below does not include factors beyond Nicole and Lauren's annual salary. Later graphs will include the cumulative effects of cost of living and salary.

Starting Net Worth Difference (2020)
Ending Net Worth Difference (2040)
Ending Net Worth Multiple (2040)
2

Cost of Living iv

Cost of living expenses include costs such as housing, transportation, food, healthcare, education, clothing, and childcare. Housing costs accounted for 37.7% of the average DC area household income from 2019-2020. 8 Most D.C. residents rent their home, but gentrification (including external investments and new building projects) has increased property taxes in the city. Gentrification is defined as the “process in which a poor area (as of a city) experiences an influx of middle-class or wealthy people who renovate and rebuild homes and businesses and which often results in an increase in property values and the displacement of earlier, usually poorer residents.” 9 In D.C., 58% of Black families own their home compared to 78% of White families. 10 Black D.C. households on average have a lower income than White DC residents, making rent a larger portion of their household income, limiting income available to build wealth. Increasing rent costs affect many Black D.C. residents; 20% of residents in predominantly Black Wards 7 and 8 indicated they would most likely move in the next three years due to high rent prices. 11 Homeownership contributes significantly to wealth. 12 The racial differences in homeownership and home valuation further impact the racial wealth gap. 13 However, for the sake of this example, only renting was considered.

Based on 2019 data from the U.S. Bureau of Labor Statistics, U.S. households spend about $25,000 + 47% of their pre-tax income on living expenses. 14 Based on their respective salaries alone, this relationship between living expenses and income suggests Nicole's cost of living is approximately $47,800 and Lauren's cost of living is $98,100. Due to their salary differential, Lauren spends a smaller proportion of her income on living expenses. Use the sliders to see the impact of increasing or decreasing the cost of living expenses for the two women.

Percentage of Nicole's Income
1.00x
Percentage of Lauren's Income
?
Starting Net Worth Difference (2020)
Ending Net Worth Difference (2040)
Ending Net Worth Multiple (2040)

Note: A "Net Worth Multiple" less than zero indicates that either Lauren or Nicole is in debt. In this case, a low negative multiple means that one person's wealth is comparable to another's indebtedness.

3

Employment Securityv

Gaps in employment contribute to differences in wealth growth between racial groups. Data from 2021 shows that Black U.S. residents are more likely to be unemployed than White residents. Nationally, unemployment rate of Black residents is 1.6 times that of White residents. This difference is even larger in Washington D.C., where Black individuals were four times more likely to be unemployed than White DC residents. 15 This disparity is higher compared to neighboring states due to racial segregation and the unique emphasis on white-collar federal employment in D.C. 16 White D.C. residents are more likely than Black D.C. residents to have access to high salary professional or social job networks, which can perpetuate racial inequalities in hiring practices because those with a more robust job network are more likely to be aware of job openings and are more likely to receive a social referral. 17

The duration of periods of unemployment also differs by race. In D.C. from 2021-2022, unemployed White residents had an average of 23.1 weeks unemployed while Black residents had an average of 26.8 weeks unemployed. 18 Nationally, gaps in employment lead to longer periods without income, and in periods of economic shock (such as a recession) Black families take longer to recover because Black workers are often “last hired” during economic recoveries. 19 20

In this scenario, imagine that Nicole experiences 27 weeks of unemployment in a year, while Lauren experiences 23 weeks of unemployment in a year. During her period of unemployment, Lauren had access to extensive professional and social networks with connections in the legal profession. Her professional networks notified and referred her for high salary job openings, reducing her period of unemployment and income loss.

Use the sliders below to see how differing stretches of unemployment for Nicole and Lauren widen the net worth gap. If you check the “Equalize Lauren and Nicole's Income and Expenses” box, you can see the impacts of unemployment even if income and expenses are equal for the two women.

Starting Net Worth Difference (2020)
Ending Net Worth Difference (2040)
Ending Net Worth Multiple (2040)

Note: A "Net Worth Multiple" less than zero indicates that either Lauren or Nicole is in debt. In this case, a low negative multiple means that one person's wealth is comparable to another's indebtedness.

4

Inherited Wealth vi

Inheritances contribute roughly 4 percent of annual U.S. household income (and are usually untaxed by the U.S. government). 21 According to data from the Federal Reserve Board, 26% of White U.S. families receive an inheritance, while only 8% of Black families do. Additionally, the average inheritance value for Black U.S. families is 35% that of White families. 22 The inherited wealth differential can have downstream effects, leaving Black families on average with fewer resources available for wealth building. These effects are passed along from generation to generation preserving historical wealth inequality.

If Lauren's inheritance is $100,000, according to the national average Nicole's inheritance is $35,000. For now, assume an equal rate of return on the inheritances. Use the sliders to see how changing the inheritance amounts for the two women impacts the wealth gap. The next section will discuss how different rates of return can further widen this gap.

Starting Net Worth Difference (2020)
Ending Net Worth Difference (2040)
Ending Net Worth Multiple (2040)
5

Return from Investments: How Wealth Generates Wealth vii

Those with higher incomes and more accumulated wealth will have more money left after covering living expenses and can invest more, in turn earning larger returns on the larger principal. Larger return on investment increases the amount an individual or household can then further invest, continuing the wealth generating cycle. Some financial tools and services which offer higher returns on investments, such as high-interest savings or brokerage and advisory accounts, may require a minimum deposit, and/or market only to customers in a higher income bracket. Further, high-return investments carry greater risk of financial loss, especially in the short term, and the financial stability of people with lower income is more sensitive to that risk.

Homeownership can also be a key form of investment; for many families, their home is one of their largest assets and differential property value appreciation leads to exponential differences in wealth. Racial income disparity like that in Washington, D.C. results in higher rates of return on investment for White households compared to Black households. 23 Housing value across the United States appreciates at different rates in White and Black neighborhoods. 24 Additionally, Black families can face challenges to investing in home ownership due to housing discrimination and the ongoing impacts of segregation and redlining.

Furthermore, being underbanked or unbanked (having less or no access to banks) limits the ability of Black families to accumulate interest over time and their ability to accelerate wealth building through higher return financial investments. 25 In the United States, the median amount in checking and savings was $425 for Black households vs. $7,000 for White households in 2019. 26 On the other hand, White families are more likely to invest in the stock market and have riskier investments with higher rewards; 27 in 2019 the median amount in brokerage accounts was $28,000 for White households versus $9,000 for Black households. 28 In addition, some workers (typically in higher wage jobs) also have access to tax-advantaged financial assets through their employer. As discussed earlier, occupational segregation may mean that Black residents are less likely to have access to these assets than their White counterparts. For instance, in 2019 the median amount in retirement accounts was $50,000 for Black U.S. households versus $110,000 for White U.S. households. 29 Building wealth through higher incomes, owning a home, growing savings and lower debt values provides cushion to absorb financial stocks (such as unexpected car or health expenditures), financial stressors or missteps.

Use the sliders below to see how a difference in the rate of return on assets affects Lauren and Nicole's net worth. In this model, the sliders only correspond to the interest Lauren and Nicole are earning on the average inheritance for Black ($35,000) and White ($100,000) families as noted in the previous graph. Since Lauren is invested in the stock market, her money grows at an average of 10%, 30 while Nicole's interest earning savings account grows her money at a rate of 0.08%. 31 Other sources of wealth such as income are not included here, but these factors would further increase the difference in return on investment.

Starting Net Worth Difference (2020)
Ending Net Worth Difference (2040)
Ending Net Worth Multiple (2040)
6

Interest on Debt: How Debt Generates Debt viii

Debt can be cyclical. Debt earns interest, adding to the original amount owed, and some types of debt accrue interest more quickly than others. If a debt is not paid off, it will increase as interest and the amount owed will continue to accumulate over time. Sources of debt can include medical expenses, student loans, auto loans, and credit card charges. When debt has a high interest rate and/or an individual's income or life circumstances limit their ability to keep up with payments, credit scores can decline, leading to further increases in interest rates on loans. In D.C., communities of color are five times more likely to have debt in collections than White communities, 32 while White D.C. residents have lower median debt values, in addition to higher median income and home value. 33

Banking access and policies can also impact debt. Nationally, Black residents can often experience lower banking access, higher banking fees, and a higher percentage of income required to deposit to avoid fees. 34 Combined with distrust due to prior discriminatory and predatory practices, many Black residents may turn to short-term loan options rather than a bank. These short-term options, such as informal savings clubs, have higher fees and fewer consumer protections.

Student loans are a frequent form of debt, and Black D.C. households are more likely than White households to have student loan debt. 35 Since 2006, undergraduate direct and federal subsidized student loan interest rates have ranged from 2.75% to 6.8%. 36 When a student does not complete a college degree, it is more difficult to pay back the loans, which can lead to increased debt in early adulthood that can carry forward in life. Additionally, predatory student lending (including misleading students about promises for low tuition and job prospects/income expectations after graduation) has a disproportionate impact on minorities. 37 Parental support is the greatest financial contribution to most students' educations at an annual national average of $11,862; 38 however, parents with less accumulated wealth (due to the factors and feedback loops discussed on this page) sometimes cannot afford to contribute to higher education costs.

Assuming Nicole has a student loan debt of $23,400 and Lauren has a student loan debt of $16,000 (the 2016 average debts for Black versus White college graduates), 39 you can position the sliders for their respective incomes to see how their debt burden changes over time. As an individual's income increases, they are able to pay off the debt faster, reducing the amount of interest accrued. You can also adjust the sliders for amount borrowed for each individual to see the impacts.

Starting Net Worth Difference (2020)
Ending Net Worth Difference (2040)
Ending Net Worth Multiple (2040)

Note: A "Net Worth Multiple" less than zero indicates that either Lauren or Nicole is in debt. In this case, a low negative multiple means that one person's wealth is comparable to another's indebtedness.

7

Putting It All Together ix

In this household finance dynamic model, we see that White D.C. residents start in a stronger financial position than Black D.C. residents, putting them in a better position to be able to continue building wealth over time. Because multiple factors (such as income, cost of living, employment security, inherited wealth, return on investments, interest on debt, and others not included in these graphs) influence the wealth gap, effective interventions to decrease the racial wealth gap must be highly coordinated to impact the existing systems. Isolated interventions, such as increasing salaries or employment or lowering costs, will not close the gap because disparities in each contributing factor compound. Although homeownership was not included in the factors considered, homeownership contributes significantly to household wealth.

This final model shows the cumulative effects of each of the factors discussed on this page over a 20-year period on Nicole and Lauren's net worth. Interest generates additive effects for both wealth building and debt so just as some individuals or families build wealth over time, others can sink further into a cycle of debt.

Models like these can be extended and enhanced with community input, survey data, and social science research. Thus, policymakers can evaluate the financial impact of proposed policies and interventions in their communities.

Starting Net Worth Difference (2020)
Ending Net Worth Difference (2040)
Ending Net Worth Multiple (2040)

Note: A "Net Worth Multiple" less than zero indicates that either Lauren or Nicole is in debt. In this case, a low negative multiple means that one person's wealth is comparable to another's indebtedness.

Acknowledgements

Modeling and prototyping by Zachary Danial and Joshua Stadlan; concept by Joshua Stadlan; research by Lilly Boyer, Saimun Habib, and Hannah Leker; text by Lilly Boyer and Hannah Leker; web development by Dylan Phelan and Zachary Danial; review by Jenine Patterson, Dr. Hannah De los Santos, Rachel Bergstein, and Julianna Bernardi.

Disclaimer

These models are thinking aids for conceptual illustration only, to review general trends of relationships between income, expenses, savings, debt, and investments. They do not account for inflation, taxation, market behavior, stochasticity, family dynamics, financial behaviors, and other socioeconomic factors and externalities. For quantitative modeling appropriate for comparing policies, prioritizing grants, analyzing historical events, or forecasting need, please contact the Social Justice Platform modeling team at socialjustice@mitre.org

  1. https://www.urban.org/research/publication/color-wealth-nations-capital

  2. What is ’Net Worth’. The Economic Times. Retrieved 25 July 2022. Available: https://economictimes.indiatimes.com/definition/net-worth .

  3. Ganti, A. (2021 August 05). Positive Feedback. Investopedia. https://www.investopedia.com/terms/p/positive-feedback.asp

  4. Data USA, “Data USA: Washington, DC,” [Online]. Available: https://datausa.io/profile/geo/washington-dc/. [Accessed 4 June 2021].

  5. https://www.dcfpi.org/wp-content/uploads/2020/01/Black-Workers-Matter-PDF-2.pdf

  6. https://www.dcfpi.org/wp-content/uploads/2020/01/Black-Workers-Matter-PDF-2.pdf

  7. The Racial Wealth Gap in Washington D.C., https://sjp.mitre.org/resources/MITRE-DC-Racial-Wealth-Gap-Study.pdf

  8. https://www.bls.gov/regions/mid-atlantic/news-release/consumerexpenditures_washington.htm

  9. Merriam-Webster. Gentrification. https://www.merriam-webster.com/dictionary/gentrification

  10. K. Kijakaz, R. Atkins, M. Paul, A. Price, D. Hamilton and W. Darity, “The Color of Wealth in the Nation’s Capital,” Urban Institute, November 2016 . [Online]. Available: https://www.urban.org/sites/default/files/publication/85341/2000986-2-the-color-of-wealth-in-the-nations-capital_8.pdf .

  11. Government of the District of Columbia, Washington, D .C ., “DC Housing Survey Report,” June 2019 . [Online] . Available: https://dmped.dc.gov/sites/default/files/dc/sites/dmped/publication/attachments/Formatted%20DC%20Housing%20Survey%20Report_FINAL%206-24_1.pdf. [Accessed 18 June 2021].

  12. The Racial Wealth Gap in Washington D.C. https://sjp.mitre.org/resources/MITRE-DC-Racial-Wealth-Gap-Study.pdf

  13. The Racial Wealth Gap in Washington D.C. https://sjp.mitre.org/resources/MITRE-DC-Racial-Wealth-Gap-Study.pdf

  14. U.S. Bureau of Labor Statistics. (2022). Consumer Expenditure Surveys: Calendar year and midyear means, shares across all items, and coefficients of variation tables by demographic characteristics, 2012 and July 2011 to June 2012 respectively, forward. Retrieved from: https://www.bls.gov/cex/tables.htm#calendar.

  15. https://www.epi.org/indicators/state-unemployment-race-ethnicity/

  16. https://www.epi.org/indicators/state-unemployment-race-ethnicity/

  17. Busette, C., Lawrence, J. S. Reeves, R. V. Nzau, N. How We Rise: How social networks impact economic mobility in Racine, WI, San Fransisco, CA, and Washington, DC. Brookings. [Accessed 15 June 2022]. https://www.brookings.edu/essay/how-we-rise-how-social-networks-impact-economic-mobility-in-racine-wi-san-francisco-ca-and-washington-dc/

  18. https://www.bls.gov/web/empsit/cpsee_e18.htm

  19. Couch KA, Fairlie R. Last hired, first fired? Black-white unemployment and the business cycle. Demography. 2010;47(1):227-247. doi:10.1353/dem.0.0086

  20. https://www.epi.org/indicators/state-unemployment-race-ethnicity-2020q3q4/

  21. https://www.brookings.edu/blog/up-front/2020/02/27/examining-the-black-white-wealth-gap/

  22. https://www.mckinsey.com/industries/public-and-social-sector/our-insights/the-economic-impact-of-closing-the-racial-wealth-gap

  23. A.Traub, L.Ruetschlin, L.Sullivan, T.Mescede, L.Dietrich and T.Shapiro, “The Racial Wealth Gap: Why Policy Matters,” 21 June 2016.[Online].Available: https://www.demos.org/research/racial-wealth-gap-why-policy-matters .[Accessed 14 June 2021].

  24. Panel Study of Income Dynamics, public use dataset. Produced and distributed by the Survey Research Center, Institute for Social Research, University of Michigan, Ann Arbor, MI (2022). Available: https://psidonline.isr.umich.edu/

  25. K.Kijakaz, R.Atkins, M.Paul, A.Price, D.Hamilton and W.Darity, “The Color of Wealth in the Nation’s Capital,” Urban Institute, November 2016.[Online]. Available: https://www.urban.org/sites/default/files/publication/85341/2000986-2-the-color-of-wealth-in-the-nations-capital_8.pdf .

  26. Panel Study of Income Dynamics, public use dataset. Produced and distributed by the Survey Research Center, Institute for Social Research, University of Michigan, Ann Arbor, MI (2022). Available: https://psidonline.isr.umich.edu/

  27. F.Killewald, T.Pfeffer and J.N.Schachner, “Wealth Inequality and Accumulation,” Annual Review of Sociology, vol.43, no.1, p.379–404, July 2017.

  28. Panel Study of Income Dynamics, public use dataset. Produced and distributed by the Survey Research Center, Institute for Social Research, University of Michigan, Ann Arbor, MI (2022). Available: https://psidonline.isr.umich.edu/

  29. Panel Study of Income Dynamics, public use dataset. Produced and distributed by the Survey Research Center, Institute for Social Research, University of Michigan, Ann Arbor, MI (2022). Available: https://psidonline.isr.umich.edu/

  30. https://www.businessinsider.com/personal-finance/average-stock-market-return

  31. https://www.fdic.gov/resources/bankers/national-rates/index.html#footnote

  32. Urban Institute, “Debt in America: An Interactive Map,” December 2020.[Online].Available: https://apps.urban.org/features/debt-interactive-map/?type=overall&variable=pct_debt_collections&state=11 . [Accessed 4 June 2021].

  33. K. Kijakaz, R. Atkins, M. Paul, A. Price, D. Hamilton and W. Darity, “The Color of Wealth in the Nation’s Capital,” Urban Institute, November 2016. [Online]. Available: https://www.urban.org/sites/default/files/publication/85341/2000986-2-the-color-of-wealth-in-the-nations-capital_8.pdf .

  34. A. Florant, J. P. Julien, S. Stewart, N. Yancy and J. Wright, “The case for accelerating financial inclusion in black communities,” 25 February 2020. [Online]. Available: https://www.mckinsey.com/industries/public-and-social-sector/our-insights/the-case-for-accelerating-financial-inclusion-in-black-communities#

  35. K . Kijakaz, R . Atkins, M . Paul, A . Price, D . Hamilton and W . Darity, “The Color of Wealth in the Nation’s Capital,” Urban Institute, November 2016 . [Online] . Available: https://www.urban.org/sites/default/files/publication/85341/2000986-2-the-color-of-wealth-in-the-nations-capital_8.pdf .

  36. https://studentaid.gov/understand-aid/types/loans/interest-rates

  37. Brei’a Womack, Predatory Student Lending: The Disparate Impact on Minorities‘ Higher Education Plans, 24 Pub. Interest L. Rptr. 43 (2018). Available at: https://lawecommons.luc.edu/pilr/vol24/iss1/6

  38. https://educationdata.org/how-do-people-pay-for-college

  39. https://www.brookings.edu/wp-content/uploads/2016/10/es_20161020_scott-clayton_evidence_speaks.pdf

  40. These models are thinking aids for conceptual illustration only, to review general trends of relationships between income, expenses, savings, debt, and investments. They do not account for inflation, taxation, market behavior, stochasticity, family dynamics, financial behaviors, and other socioeconomic factors and externalities. For quantitative modeling appropriate for comparing policies, prioritizing grants, analyzing historical events, or forecasting need, please contact the Social Justice Platform modeling team at socialjustice@mitre.org.

  41. N e t W e a l t h ( t y e a r s ) = i n c o m e a n n u a l × t y e a r s where annual income is the free parameter.

  42. The median income for Black households in 2019 was $48,487 and $155,562 was the median income for White households in 2019.

  43. N e t W e a l t h ( t y e a r s ) = ( i n c o m e a n n u a l c o s t O f L i v i n g ) × t y e a r s where Cost Of Living is the free parameter

  44. An image detailing assumptions made in the unemployment model
  45. An image detailing assumptions made in the inheritance model

  46. Same model as in inherited wealth, but holding InheritanceAmount and making AnnualRateOfReturn the free parameter.

  47. An image detailing assumptions made in the debt model

  48. An image detailing assumptions made in the cumulative model