A Systems Analysis of the Black-White Racial Wealth Gap in the District of Columbia

The Council of the District of Columbia's Office of Racial Equity (CORE) requested an analysis of the District's Black-White racial wealth gap to inform Council deliberations and to support the design of racially equitable legislation. MITRE offered a data-driven systems approach to understanding the racial wealth gap in the District. The analysis combined quantitative data like census statistics with participatory qualitative data, including real stories from D.C. residents, to:

  • Facilitate shared understanding of the current wealth building system in D.C., including how it operates and how to introduce change;
  • Offer methods for exploring how Black and White D.C. residents of different socioeconomic profiles experience the system differently; and
  • Draw on D.C. residents' lived experiences to identify leverage points best suited to address the racial wealth gap.

The explainer below highlights how CORE and MITRE used a conceptual model to improve understanding of a complex issue and inform additional analyses and planning. See the full report for greater detail as well as considerations for goal setting, measuring progress, and solution design with communities most impacted by wealth inequities.

1

About the Black-White Racial Wealth Gap

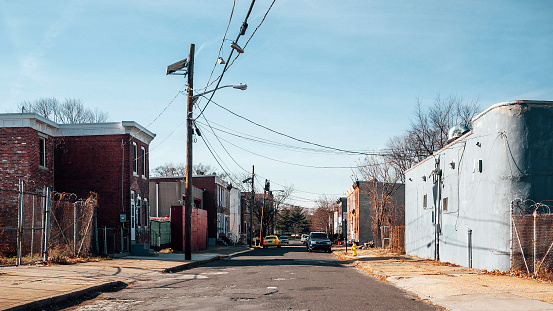
Wealth is made up of assets like dwellings, land, currency and deposits, stocks, minus liabilities like mortgages and consumer loans. In Washington, D.C., the wealth gap between Black and White Washington, D.C. residents is stark. White residents tend to have greater assets and fewer liabilities than Black residents. White residents are more likely than Black residents to be homeowners, and their homes are valued twice as high. Median White household income is three times that of Black households. Black residents experience poverty at three times the rate of White residents. In 2013-2014 median White household net worth was $284,000, over 81 times the median Black household net worth of $3,500 (Urban Institute, 2016).

Average Property Value in Washington, D.C. by Race and Ethnicity

Dec 8, 2021
Notifications: 173 ± 6.7
Devices: 135,644
About this data
Source: U.S. Census Bureau; American Community Survey, 2014-2019 American Community Survey 1-Year Estimates

Median Household Income in Washington, D.C. by Race

Dec 8, 2021
Notifications: 173 ± 6.7
Devices: 135,644
About this data
Source: U.S. Census Bureau; American Community Survey, 2014-2019 American Community Survey 1-Year Estimates

Poverty Rate by Race and Ethnicity in Washington, D.C. (2014–2019)

Dec 8, 2021
Notifications: 173 ± 6.7
Devices: 135,644
About this data
Source: U.S. Census Bureau; American Community Survey, 2014-2019 American Community Survey 1-Year Estimates
2

Wealth as a System of Systems

Combining secondary research with qualitative data describing DC residents' lived experiences, MITRE and CORE created a diagram to capture factors forming the District's wealth building system, organize them into categories, and explore how the factors influence each other (known as a causal loop diagram). In our report, we describe each category and show how it contributes to the city's racial wealth gap. The resulting model illustrates how systemic racism underlies the racial wealth gap in Washington, D.C. - through interacting factors shaped by current and historical policies and practices, rather than one factor alone. The Aspen Institute Roundtable on Community Change explains that systemic racism is, “A system in which public policies, institutional practices, cultural representations, and other norms work in various, often reinforcing ways to perpetuate racial group inequity.” See the Social Justice Platform glossary for the complete definition and related terms.

A Causal Loop Diagram for Wealth Building in Washington, D.C.

Quality Employment and Income Factors

- - + + + + + + + - + + + + - + + business costs and expenses business profits business ownership demand for business employment bias strength of local economy strength of global economy economic diversity quality employment employer provided benefits criminal record participation in informal economy income

Workforce Readiness Factors

- + + - - + - - - - - - - + - + - - + + + - + + + - + - + + + + + + + + + education workforce readiness childcare costs student loans transporation vehicle costs disability (long or short term) disability assistance childcare availability healthy food accessibility healthcare accessibility commute available time school quality nutrition preventive care healthcare costs physical health medical debt mental health & sense of well-being health insurance costs public transit costs

Homeownership and Living Expense Factors

+ + + + + + + + + + + - + + + + - + homeownership & real estate ownership homeownership tax break real estate knowledge historic redlining non-financial assets rent or mortgage costs zoning laws stability desirability of location strength of interest rate cost of living expenses utilities and wifi costs real estate value external investor competition
3

Key Feedback Loops Driving Washington, D.C.'s Racial Wealth Gap

In a system, feedback loops occur when the output of one component ultimately results in further changes to the component itself. For example, when a savings account earns interest, the interest is added to the original savings, generating even more savings, which in turn earn more interest. Reinforcing feedback loops in the system encourage the system to continue or accelerate in the same direction. For this reason, a one-time change to any individual factor (e.g., formal education level or income) in the wealth building in Washington, D.C., is unlikely to drive the overall system to sustained racial equity. There are many feedback loops in D.C.'s wealth building system working in different directions with different strength for different populations. Decision-makers will want to design strategies that consider these feedback loops and their impact on racial equity in wealth. MITRE's system analysis identifies three main loops for consideration: Investing in Employment, Building Financial Resilience, and Increasing Rates of Return from Assets.

Main Feedback Loops in Washington, D.C.'s Wealth Building System

+ + + + + + + + + + + + + + - - - - + + + + + + - - - - + + + + + + + cost ofliving debts andliabilities qualityemployment socialnetworks financialassets homeownership wealth income workforcereadiness effects of shocksstressors,and missteps outcome: freedomto live, work,and thrive personalapproaches towealth Loop 1: Investing in Employment Loop 3: Increasing Rates of Return KeyAmplifiers Loop 2:Building FinancialResilience

Investing in Employment

+ + + + + + + + + + + - - + + - - - - + + + + + + debts andliabilities qualityemployment socialnetworks financialassets wealth income workforcereadiness effects of shocksstressors,and missteps freedomto live, work,and thrive personalapproaches towealth Loop 1: Investing in Employment KeyAmplifiers

Building Financial Resilience

+ + + - - + + + - - - - + + cost ofliving debts andliabilities socialnetworks financialassets wealth income effects of shocksstressors,and missteps outcome: freedomto live, work,and thrive personalapproaches towealth KeyAmplifiers Loop 2:Building FinancialResilience

Increasing Rates of Return

+ + + + + + - - - - + + + + + + debts andliabilities socialnetworks financialassets homeownership wealth effects of shocksstressors,and missteps outcome: freedomto live, work,and thrive personalapproaches towealth Loop 3: IncreasingRates of Return KeyAmplifiers
4

How Do We Alter the Behavior of an Entire System?

MITRE offers these models to help leaders and their communities collaboratively clarify social problems and design evidence-based solutions. By identifying which feedback loops are the most impactful, systems analysis helps communities build a portfolio of coordinated interventions that accelerate progress toward social and racial equity. Additional modeling and analytics assess baseline system conditions and readiness for change, scope interventions, and inform the strategy for measuring progress over time.

These conceptual models and frameworks represent a starting point for shared understanding, building on and complementing the work of research economists, social scientists, and community members. Decision makers must continue refine and improve in continued partnership with D.C. residents and other key parties inside and outside of government.